I'm a paragraph. Click here to add your own text and edit me. It's easy.

Alternative Data
Nighttime Light Dynamics as a Geographic Risk Signal for Municipal Bonds
Abtract: This study examines whether satellite-derived nighttime-light measures can serve as an alternative indicator of municipal bond risk that can be an indication to the future trading. Focusing on transportation-related municipal bonds with similar geographic exposure, we analyze whether changes in nighttime-light intensity and spatial clustering are associated with bond-price movements over a ten-trading-day horizon. Because municipal bond prices are strongly influenced by interest-rate movements, the analysis first isolates the portion of price variation related to Treasury rates and then evaluates whether night while considering the nearby toll-gate revenue to debt maturity profiles:
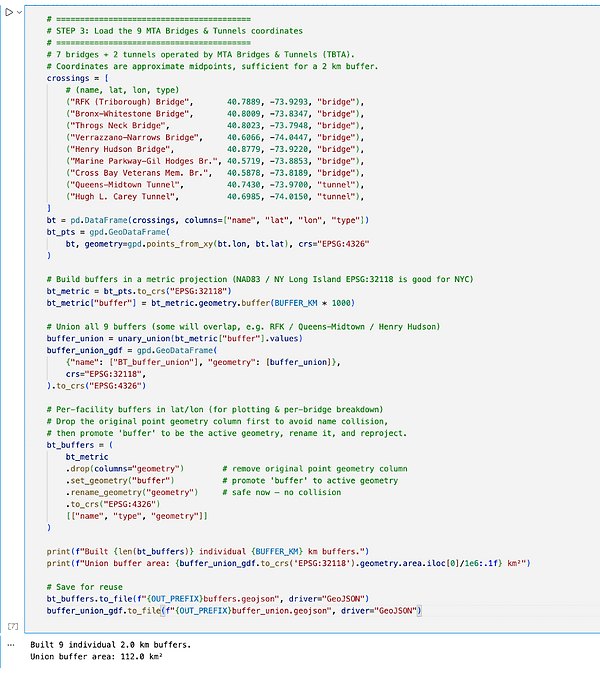
The bond that is covered is CUSIP 89602HAB3, a municipal bond that covers 9 bridges of MTA in new York. The code for the following analysis can be found at:
The initial analysis focuses on nine MTA Bridges and Tunnels facilities and constructs a monthly nighttime-light index from average VIIRS radiance within two-kilometer buffers surrounding each facility. The analysis is subsequently expanded to twenty transportation crossings across the broader New York metropolitan region. Rather than relying solely on average brightness, the study develops multiple dimensions of the satellite signal, including changes in mean brightness, within-buffer brightness dispersion, the geographic dispersion of illuminated pixels, and principal components summarizing cross-sectional lighting patterns.ime-light variables helps to explain the residual of traded price or the nearby toll gates
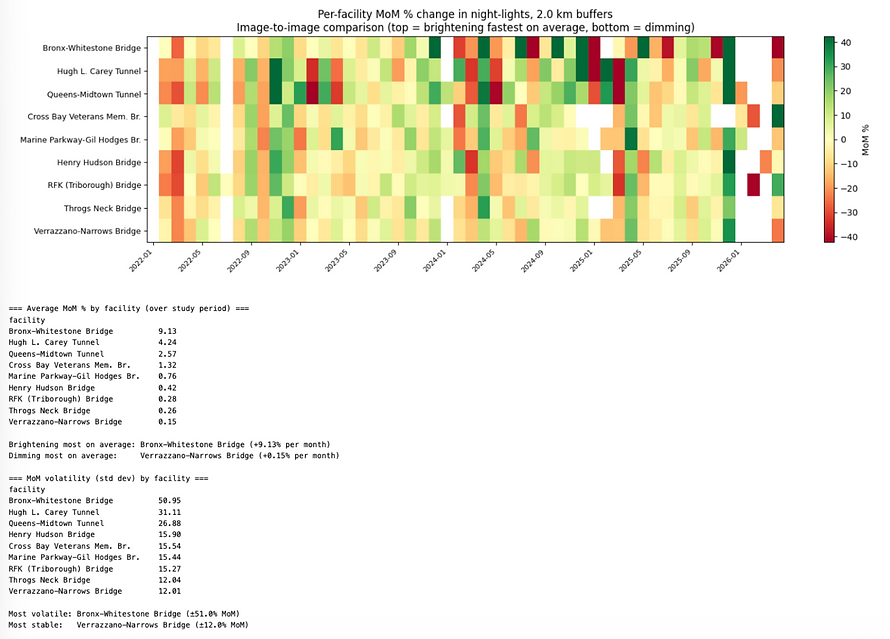
Several adjustments are introduced to separate economic information from non-economic variation in satellite imagery. NOAA weather observations are matched to individual facilities to control for snowfall, which can mechanically increase observed nighttime radiance. Municipal bond prices are also decomposed to account for movements associated with broader interest-rate conditions, allowing the analysis to examine whether geospatial signals are related specifically to the residual component of bond-price variation.
The traffic data provide an intermediate validation test for the satellite signal. If nighttime activity around a bridge or tunnel genuinely reflects changes in transportation intensity, increases in satellite-observed activity should be associated with increases in actual vehicle crossings at the corresponding facility. This allows the study to test whether the satellite signal reflects real economic activity rather than unrelated changes in nighttime illumination. The proposed economic relationship can therefore be interpreted as a sequence. First, changes in nighttime activity may capture changes in local transportation activity. Second, increased transportation activity may lead to higher bridge and tunnel usage. Third, greater usage may contribute to higher toll revenue. Finally, stronger toll-related fundamentals may affect the valuation or credit spread of MTA transportation bonds.

This creates a more direct economic explanation for the relationship between satellite imagery and municipal bond prices. Rather than relying only on a statistical correlation between nighttime lights and bond prices, the analysis tests whether the satellite signal is connected to an observable source of economic activity that supports the transportation system.Toll-rate changes must also be considered when analyzing toll revenue.
Toll revenue can increase either because more vehicles use a facility or because the toll charged per vehicle has increased. A rise in revenue following a scheduled toll increase therefore does not necessarily indicate stronger transportation demand. The analysis should distinguish changes in traffic volume from changes in toll rates and incorporate major toll-policy changes as controls.The traffic analysis can subsequently be combined with reported toll revenue from MTA financial or engineering reports. Comparing vehicle crossings, satellite activity, and toll revenue would provide a stronger test of the underlying economic mechanism. If increases in nighttime activity are followed by increases in traffic and toll revenue, the satellite signal would have a clearer interpretation as an alternative indicator of transportation-related economic activity.The final stage of the analysis examines whether these changes in transportation fundamentals are reflected in MTA bond prices or credit spreads. An important question is whether the municipal bond market incorporates changes in traffic and toll conditions immediately or whether there is a measurable delay.

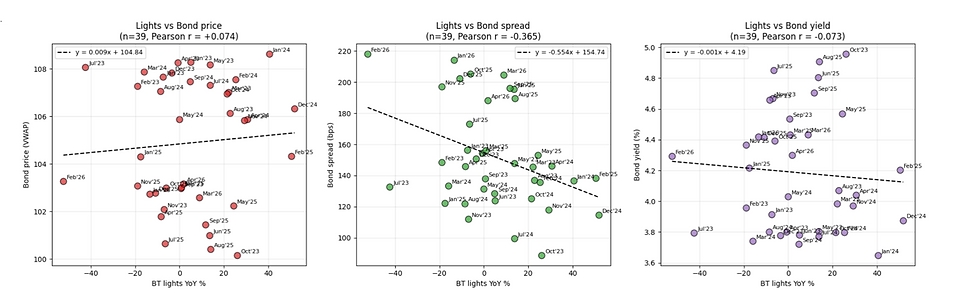
This study examines whether satellite-derived nighttime-light measures contain information about municipal bond risk beyond conventional interest-rate variables. Using geographically mapped nighttime-light intensity and spatial clustering measures, we investigate whether changes in local light conditions are associated with subsequent bond-price movements over a ten-trading-day horizon. The analysis first removes the component of bond-price variation associated with Treasury-rate movements and then tests whether geographic light variables explain the remaining variation. To distinguish bond-specific effects from regional effects, the methodology is evaluated across multiple bonds with similar geographic and economic exposure. The study contributes to the growing use of alternative geospatial data in asset pricing by examining whether satellite-observed economic activity can provide an additional risk-state indicator in relatively opaque municipal bond markets.That is actually a very useful distinction. The research claim becomes much more interesting: satellite imagery may tell us something about the local economic/risk environment that traditional bond-market variables do not fully capture.If you develop it into a larger panel of bonds and show that the relationship survives Treasury controls, issuer controls, maturity controls, weather adjustments, and out-of-region testing, you would have a much more credible empirical paper rather than simply a profitable backrest.
The research claim becomes much more interesting: satellite imagery may tell us something about the local economic/risk environment that traditional bond-market variables do not fully capture.If you develop it into a larger panel of bonds and show that the relationship survives Treasury controls, issuer controls, maturity controls, weather adjustments, and out-of-region testing, you would have a much more credible empirical paper rather than simply a profitable backtest.The traffic data were collected from the MTA bridge and tunnel traffic dataset available through NYC Open Data. The raw dataset was downloaded in manageable chunks because of its large size, after which facility names, dates, and vehicle-crossing counts were cleaned and standardized. Observations were then restricted to facilities with usable coverage in the sample Henry Hudson Bridge, Hugh L. Carey Tunnel, and Throgs Neck Bridge and individual traffic records were aggregated to the monthly level by summing vehicle crossings for each facility. Month-over-month (MoM) traffic growth was calculated as the percentage change in monthly crossings relative to the preceding month. To construct the series shown in the figure, the facility-level MoM growth rates were averaged equally across the covered facilities for each month, and the visualization was restricted to January 2024 onward. Thus, the plotted series represents the average monthly change in traffic activity across the three MTA facilities for which consistent observations were available.
Sample coding work:
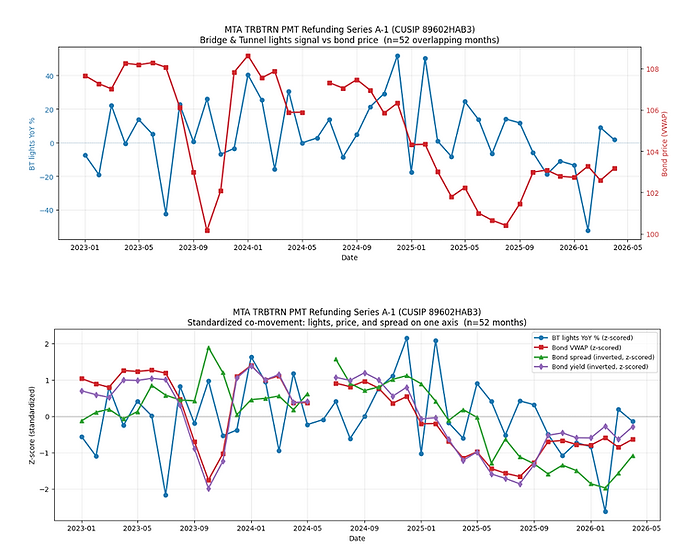
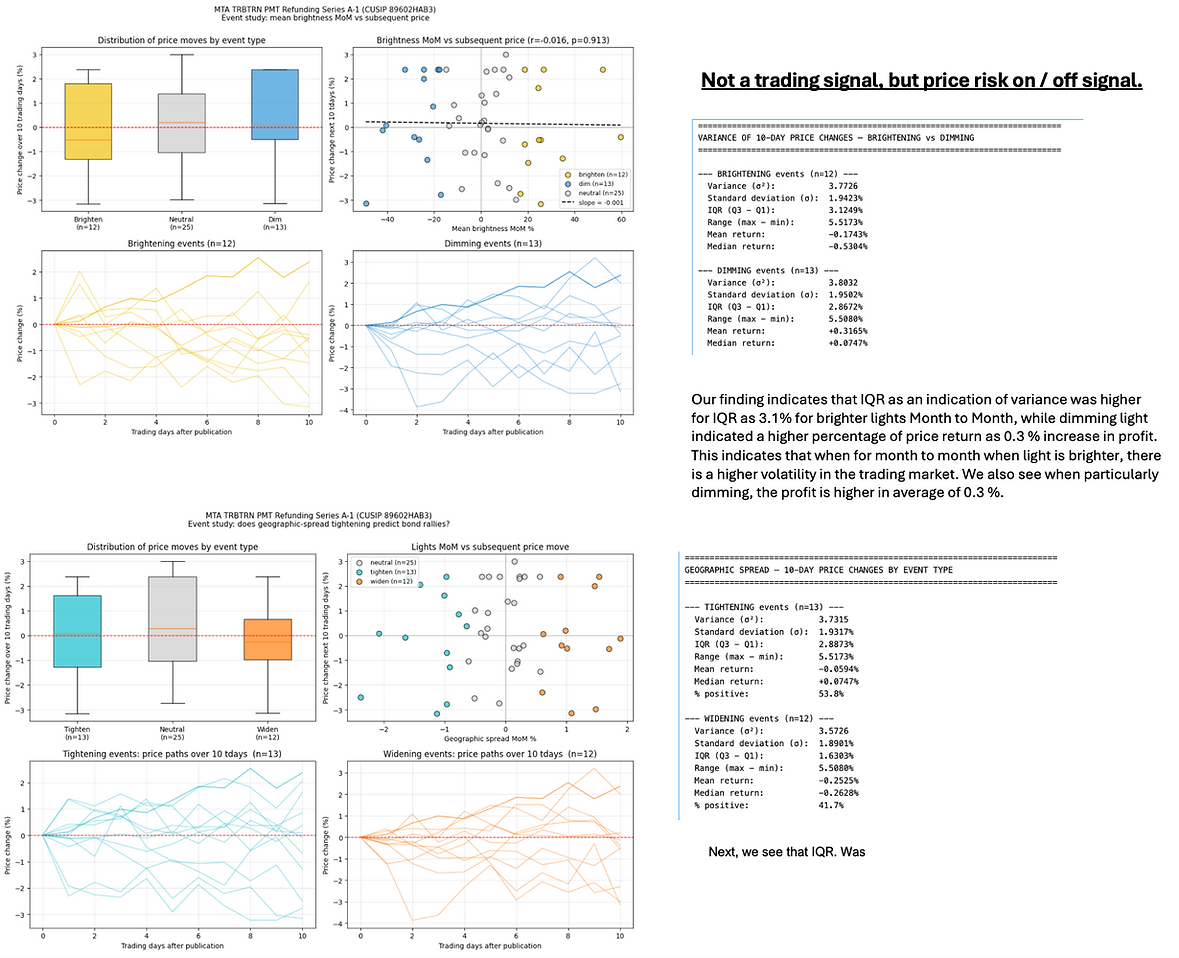
Different light source strategies:The analysis considers three complementary satellite-light strategies to capture different dimensions of transportation-related activity around MTA bridge and tunnel facilities. The first strategy uses the month-to-month change in mean nighttime brightness, which measures whether overall illuminated activity across the monitored locations is increasing or decreasing. The second strategy focuses on changes in the spatial shape of the light distribution within each facility buffer, capturing whether illuminated clusters become more concentrated or more dispersed over time. The third strategy measures cross-facility dispersion, which evaluates whether the lighting patterns of individual bridges and tunnels are becoming more similar or increasingly differentiated from one another. These measures are compared with monthly changes in the bond spread to determine whether different forms of geospatial activity contain information relevant to municipal credit conditions. Rather than relying on a single brightness measure, the three strategies distinguish between the overall intensity of activity, the local spatial organization of that activity, and the degree of divergence across facilities. The figure suggests that these light-based indicators can experience substantial changes in specific months, while the bond spread also exhibits periods of pronounced widening and tightening; however, the relationship is not uniformly one-to-one, indicating that each light measure may capture a different aspect of the underlying economic environment rather than functioning as an identical trading signal.

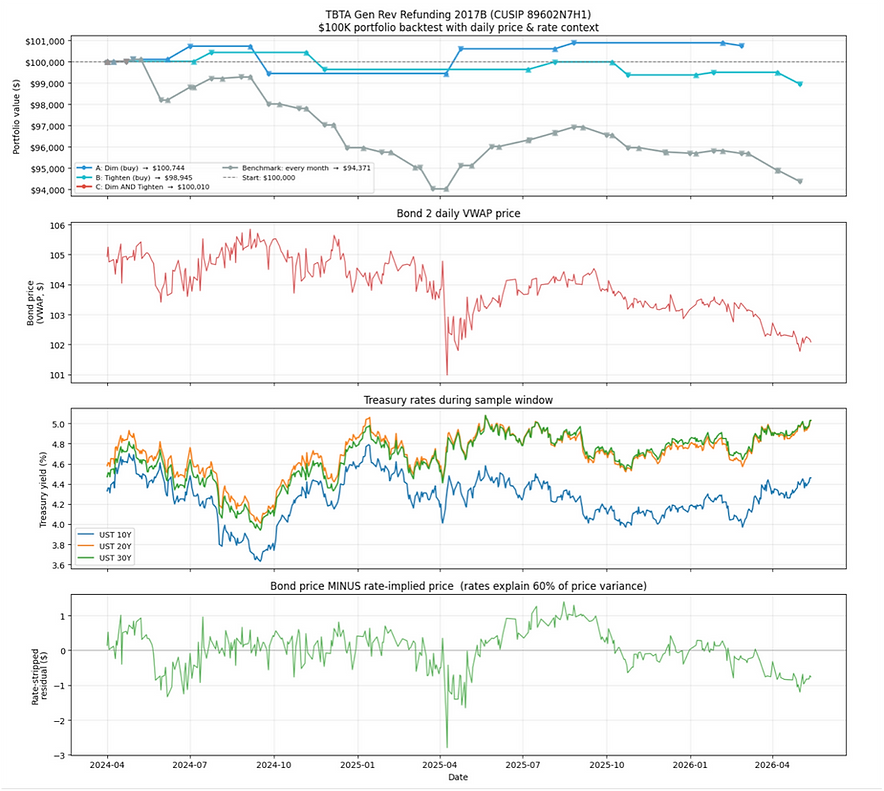


The most interesting result is therefore not that the satellite strategy produced a huge profit. It is that selective entry avoided much of the loss experienced by the benchmark. The dimming strategy finished slightly positive while the mechanical monthly strategy lost about 5.6%, a difference of roughly 6.4 percentage points. Even the tightening and combined rules substantially preserved capital relative to the benchmark. Starting from a hypothetical $100,000 portfolio, the dimming-based strategy ended at approximately $100,744, compared with approximately $94,371 for a strategy that entered the bond every month. The tightening-only and combined strategies ended near $98,945 and $100,010, respectively. The results therefore suggest that the primary benefit of the alternative-data signal may be its ability to avoid unfavorable periods rather than to generate large absolute returns. Because Treasury-rate movements explain a substantial portion of the underlying bond-price variation, the evidence is more consistent with a selective exposure mechanism than with a pure directional forecasting strategy.
Let’s Work Together
Get in touch so we can start working together.


